今回はお客さまから「当日分がいつも最初に見える、かつ手動で新しい月を追加しなくてもいいガントチャートを作ってほしい」とご依頼いただきました。
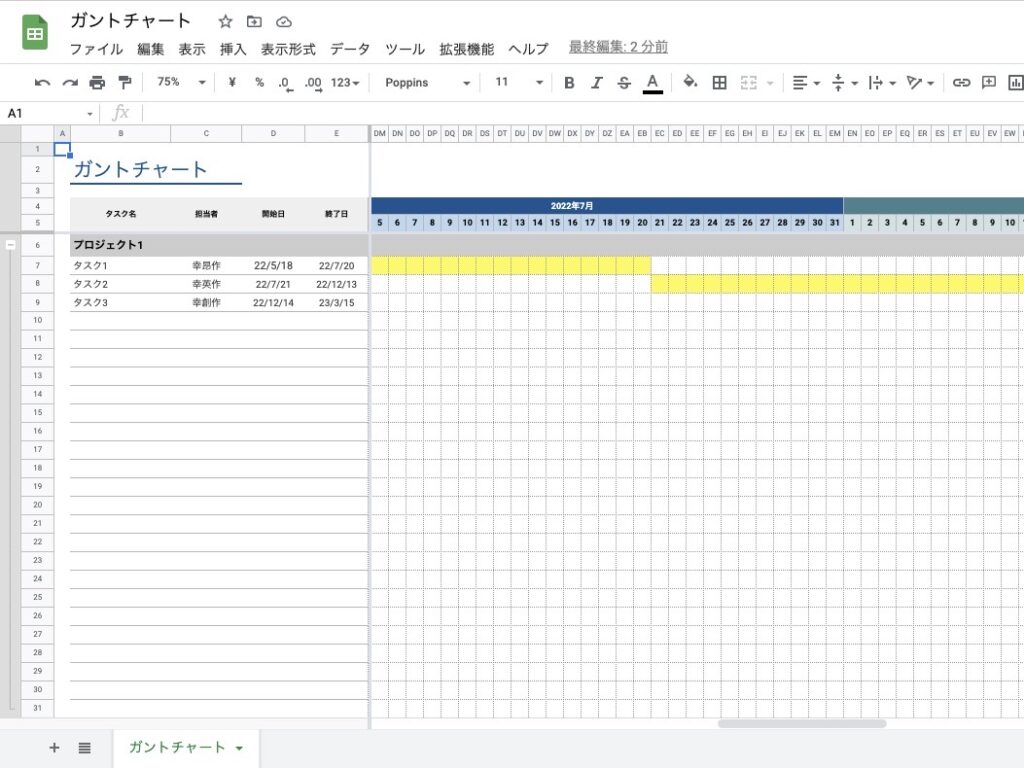
実際に作成したガントチャートはこちらです。
実際にお使いになられるときはファイルを丸ごとコピーしてください。
//毎日F列を削除する関数
function deleteColumn() {
  var spreadsheet = SpreadsheetApp.getActiveSpreadsheet();
  var sheet = spreadsheet.getSheetByName('ガントチャート');
  sheet.deleteColumn(6);
  var range1 = sheet.getRange('F4');
  var range2 = sheet.getRange('F5');
  var today = range2.getValue();
  var thisMonth = Utilities.formatDate(today, 'Asia/Tokyo', 'yyyy年M月');
  range1.setValue(thisMonth);
}

//毎月1日に新しい1ヶ月分のカレンダーを追加する関数
function addGanttChart() {
  var spreadsheet = SpreadsheetApp.getActiveSpreadsheet();
  var ganttChartSheet = spreadsheet.getSheetByName('ガントチャート');
  var templateSheet = spreadsheet.getSheetByName('ガントチャートテンプレ');

  var lastColumn = ganttChartSheet.getLastColumn();
  var copyToRange = ganttChartSheet.getRange(4, lastColumn + 1);
  var lastDate = ganttChartSheet.getRange(5, lastColumn).getValue();
  var lastDateMonth = Utilities.formatDate(lastDate, 'Asia/Tokyo', 'M');
  var lastDateYearMonth = Utilities.formatDate(lastDate, 'Asia/Tokyo', 'yyyy/M');
  lastDate.setDate(lastDate.getDate() + 1);
  var nextMonth = Utilities.formatDate(lastDate, 'JST', 'yyyy年M月');
  var nextMonthBase = Utilities.formatDate(lastDate, 'JST', 'yyyy/M/');

  var bkColor = ganttChartSheet.getRange(5, lastColumn).getBackground();

  if (lastDateMonth === '3' || lastDateMonth === '5' || lastDateMonth === '8' || lastDateMonth === '10') {
    var data30days = templateSheet.getRange('A1:AE80');
    var dateColorRange = ganttChartSheet.getRange(5, lastColumn + 1, 1, 30);
    data30days.copyTo(copyToRange);
    copyToRange.setValue(nextMonth);
    if (bkColor === '#bdd7ee') {
      copyToRange.setBackground('#45818e');
      dateColorRange.setBackground('#d0e0e3');
    } else if (bkColor === '#d0e0e3') {
      copyToRange.setBackground('#833c0c');
      dateColorRange.setBackground('#f8cbad');
    } else if (bkColor === '#f8cbad') {
      copyToRange.setBackground('#806000');
      dateColorRange.setBackground('#ffe699');
    } else if (bkColor === '#ffe699') {
      copyToRange.setBackground('#0b5394');
      dateColorRange.setBackground('#bdd7ee');
    }

    for (var i = 1; i <= 30; i++) {
      var nextMonthDate = nextMonthBase + i;
      ganttChartSheet.getRange(5, lastColumn + i).setValue(nextMonthDate);
    }

  } else if (lastDateMonth === '2' || lastDateMonth === '4' || lastDateMonth === '6' || lastDateMonth === '7' || lastDateMonth === '9' || lastDateMonth === '11' || lastDateMonth === '12') {
    var data31days = templateSheet.getRange('AG1:BL80');
    var dateColorRange = ganttChartSheet.getRange(5, lastColumn + 1, 1, 31);
    data31days.copyTo(copyToRange);
    copyToRange.setValue(nextMonth);
    if (bkColor === '#bdd7ee') {
      copyToRange.setBackground('#45818e');
      dateColorRange.setBackground('#d0e0e3');
    } else if (bkColor === '#d0e0e3') {
      copyToRange.setBackground('#833c0c');
      dateColorRange.setBackground('#f8cbad');
    } else if (bkColor === '#f8cbad') {
      copyToRange.setBackground('#806000');
      dateColorRange.setBackground('#ffe699');
    } else if (bkColor === '#ffe699') {
      copyToRange.setBackground('#0b5394');
      dateColorRange.setBackground('#bdd7ee');
    }

    for (var i = 1; i <= 31; i++) {
      var nextMonthDate = nextMonthBase + i;
      ganttChartSheet.getRange(5, lastColumn + i).setValue(nextMonthDate);
    }

  } else if (lastDateMonth === '1') {
    if (lastDateYearMonth === '2024/1' || lastDateYearMonth === '2028/1' || lastDateYearMonth === '2032/1' || lastDateYearMonth === '2036/1' || lastDateYearMonth === '2040/1' || lastDateYearMonth === '2044/1' || lastDateYearMonth === '2048/1') {
      var data29days = templateSheet.getRange('CR1:DU80');
      var dateColorRange = ganttChartSheet.getRange(5, lastColumn + 1, 1, 29);
      data29days.copyTo(copyToRange);
      copyToRange.setValue(nextMonth);
      if (bkColor === '#bdd7ee') {
        copyToRange.setBackground('#45818e');
        dateColorRange.setBackground('#d0e0e3');
      } else if (bkColor === '#d0e0e3') {
        copyToRange.setBackground('#833c0c');
        dateColorRange.setBackground('#f8cbad');
      } else if (bkColor === '#f8cbad') {
        copyToRange.setBackground('#806000');
        dateColorRange.setBackground('#ffe699');
      } else if (bkColor === '#ffe699') {
        copyToRange.setBackground('#0b5394');
        dateColorRange.setBackground('#bdd7ee');
      }

      for (var i = 1; i <= 29; i++) {
        var nextMonthDate = nextMonthBase + i;
        ganttChartSheet.getRange(5, lastColumn + i).setValue(nextMonthDate);
      }

    } else {
      var data28days = templateSheet.getRange('BN1:CP80');
      var dateColorRange = ganttChartSheet.getRange(5, lastColumn + 1, 1, 28);
      data28days.copyTo(copyToRange);
      copyToRange.setValue(nextMonth);
      if (bkColor === '#bdd7ee') {
        copyToRange.setBackground('#45818e');
        dateColorRange.setBackground('#d0e0e3');
      } else if (bkColor === '#d0e0e3') {
        copyToRange.setBackground('#833c0c');
        dateColorRange.setBackground('#f8cbad');
      } else if (bkColor === '#f8cbad') {
        copyToRange.setBackground('#806000');
        dateColorRange.setBackground('#ffe699');
      } else if (bkColor === '#ffe699') {
        copyToRange.setBackground('#0b5394');
        dateColorRange.setBackground('#bdd7ee');
      }

      for (var i = 1; i <= 28; i++) {
        var nextMonthDate = nextMonthBase + i;
        ganttChartSheet.getRange(5, lastColumn + i).setValue(nextMonthDate);
      }

    }
  }

  ganttChartSheet.clearConditionalFormatRules();
  var lastColumnAfterAdded = ganttChartSheet.getLastColumn();
  var rangeAfterAdded1 = ganttChartSheet.getRange(7, 6, 25, lastColumnAfterAdded - 5);
  var rule1 = SpreadsheetApp.newConditionalFormatRule()
    .setRanges([rangeAfterAdded1])
    .whenFormulaSatisfied('=AND ($E7<>"", $D7 <= F$5 , $E7 >= F$5)')
    .setBackground("#ffff00")
    .build();
  var rules1 = ganttChartSheet.getConditionalFormatRules();
  rules1.push(rule1);
  ganttChartSheet.setConditionalFormatRules(rules1);

  var rangeAfterAdded2 = ganttChartSheet.getRange(33, 6, 25, lastColumnAfterAdded - 5);
  var rule2 = SpreadsheetApp.newConditionalFormatRule()
    .setRanges([rangeAfterAdded2])
    .whenFormulaSatisfied('=AND ($E33<>"", $D33 <= F$5 , $E33 >= F$5)')
    .setBackground("#ffff00")
    .build();
  var rules2 = ganttChartSheet.getConditionalFormatRules();
  rules2.push(rule2);
  ganttChartSheet.setConditionalFormatRules(rules2);

  var rangeAfterAdded3 = ganttChartSheet.getRange(59, 6, 25, lastColumnAfterAdded - 5);
  var rule3 = SpreadsheetApp.newConditionalFormatRule()
    .setRanges([rangeAfterAdded3])
    .whenFormulaSatisfied('=AND ($E59<>"", $D59 <= F$5 , $E59 >= F$5)')
    .setBackground("#ffff00")
    .build();
  var rules3 = ganttChartSheet.getConditionalFormatRules();
  rules3.push(rule3);
  ganttChartSheet.setConditionalFormatRules(rules3);
}
こちらは2048年のうるう年まで考慮して作られています。
それ以降は79行目のコードを書き変える必要があります。
他にも、下記のトリガーを設定しました。